NIFTY PE Ratio: Today, Chart and Historical Values
If you are an investor in the Indian stock market, you must have heard of the NIFTY PE Ratio. It is one of the most widely used indicators of market valuation and sentiment. But do you know what it means, how it is calculated, and how to use it to make investment decisions? If not, don’t worry.
In this blog post, I will explain everything you need to know about the NIFTY PE Ratio in a simple and easy way. You will learn:
- How is the NIFTY PE Ratio calculated, and what does it signify?
- What level of NIFTY PE Ratio should investors keep an eye on?
- How to use NIFTY PE Ratio information for taking investment decisions
By the end of this blog post, you will have a clear understanding of the NIFTY PE Ratio and how to use it as a tool for your investment strategy.
Consider reading: NIFTY 50 Index and Weightage by Stocks
Let’s start by looking at the latest NIFTY PE ratio and historical data.
Page Contents
NIFTY PE Ratio: Historical Values and Latest in 2023
| Year | Jan | Feb | Mar | Apr | May | Jun | Jul | Aug | Sep | Oct | Nov | Dec |
|---|---|---|---|---|---|---|---|---|---|---|---|---|
| 2023 | 20.7 | 20.4 | 20.4 | 20.9 | 21.6 | 22.4 | 23 | 22 | 22.2 | 20.5 | 21.5 | – |
| 2022 | 23.4 | 21.6 | 22.9 | 22 | 20.4 | 19.5 | 20.7 | 21.2 | 20.6 | 21.4 | 22.5 | 21.8 |
| 2021 | 36.6 | 39.7 | 33.2 | 32.2 | 29.2 | 28.3 | 27 | 26.3 | 27 | 25.7 | 23.4 | 24.1 |
| 2020 | 26.4 | 25.5 | 19.4 | 22.4 | 22.4 | 26.3 | 30.2 | 32.3 | 32.7 | 31.9 | 35.7 | 38.5 |
| 2019 | 26.3 | 26.3 | 29 | 29.3 | 29.5 | 29 | 27.4 | 27.3 | 26.4 | 27.4 | 28.1 | 28.3 |
| 2018 | 27.5 | 25.7 | 24.7 | 26.7 | 27.2 | 25.9 | 28.2 | 28.4 | 26.4 | 25 | 26.3 | 26.2 |
| 2017 | 22.9 | 23.1 | 23.3 | 23.6 | 24.4 | 24.2 | 25.7 | 25.6 | 25.4 | 26.4 | 26.2 | 26.9 |
| 2016 | 20.2 | 18.9 | 20.9 | 21.2 | 22.6 | 22.8 | 23.6 | 24.1 | 23.4 | 23.3 | 21.6 | 21.9 |
| 2015 | 22.5 | 23.8 | 22.7 | 22.1 | 23.1 | 23.2 | 23.5 | 22.1 | 22.2 | 22.1 | 21.5 | 21.5 |
| 2014 | 17.7 | 17.7 | 18.9 | 18.8 | 19.8 | 20.7 | 20.6 | 20.8 | 20.8 | 21.6 | 21.9 | 21.2 |
| 2013 | 18.5 | 17.7 | 17.6 | 17.9 | 18 | 17.8 | 17.1 | 15.8 | 16.8 | 18.2 | 18.4 | 18.7 |
| 2012 | 18.5 | 19.1 | 18.7 | 18.1 | 16.7 | 17.5 | 17.1 | 17.6 | 19.2 | 18.4 | 18.6 | 18.7 |
| 2011 | 21.1 | 20.4 | 22.1 | 21.4 | 20.5 | 20.8 | 19.8 | 18.1 | 17.9 | 18.9 | 17.5 | 16.8 |
| 2010 | 21 | 20.9 | 22.3 | 22.3 | 21.3 | 22.3 | 22.3 | 22.7 | 25.5 | 24.7 | 23.4 | 24.5 |
| 2009 | 13.4 | 13.1 | 14.3 | 16.5 | 20.8 | 20 | 20.7 | 20.9 | 22.9 | 20.5 | 22.4 | 23.2 |
| 2008 | 22 | 22.3 | 20.6 | 22.2 | 20.7 | 17.3 | 18.2 | 18.4 | 16.9 | 12.6 | 12.1 | 13 |
| 2007 | 19.9 | 18 | 18.4 | 19.5 | 20.4 | 20.6 | 20.5 | 20.2 | 22.6 | 25.7 | 25.2 | 27.6 |
| 2006 | 17.9 | 18.3 | 20.3 | 20.3 | 17.5 | 18.4 | 17.6 | 19.2 | 20.9 | 20.4 | 21.2 | 21.3 |
| 2005 | 14.7 | 15 | 14.6 | 13.3 | 13.9 | 14.3 | 14.1 | 14.8 | 16.2 | 14.2 | 16 | 17.2 |
| 2004 | 20 | 19.7 | 20.7 | 18.7 | 11.9 | 12.6 | 13.6 | 13.6 | 14.6 | 14.9 | 16.4 | 15.3 |
| 2003 | 14.1 | 14.4 | 13.4 | 13.1 | 11.7 | 13 | 12.8 | 15 | 15.6 | 17.2 | 17.8 | 20.7 |
| 2002 | 17 | 18.4 | 18.1 | 17.9 | 16.2 | 15.7 | 14.3 | 15 | 14.3 | 14.5 | 14.2 | 14.8 |
| 2001 | 22.2 | 20.2 | 17.2 | 14.6 | 15.8 | 15.8 | 15.2 | 15.1 | 13.2 | 13.8 | 15.5 | 15.4 |
| 2000 | 26.2 | 26.4 | 24.6 | 21.1 | 23 | 22.9 | 20.7 | 21 | 19.3 | 17.7 | 19.2 | 19.2 |
How NIFTY PE Ratio is calculated
The NIFTY PE Ratio is the ratio of the Nifty 50 Index value to the total earnings of the 50 companies that constitute the index. The Nifty 50 Index is a benchmark index of the National Stock Exchange (NSE) that represents the performance of 50 large and liquid companies across various sectors of the Indian economy. The index value is calculated by taking the weighted average of the market capitalization of these 50 companies.
The total earnings of the 50 companies are obtained by adding up their earnings per share (EPS) for the trailing twelve months (TTM). EPS is the net profit divided by the number of outstanding shares. TTM is a period that covers the last four quarters of financial results.
The formula for the NIFTY PE Ratio is:
NIFTY PE Ratio = Nifty 50 Index Value / Total Earnings of 50 Companies
For example, as of April 9, 2023, the Nifty 50 Index value was 19,428.30 and the total earnings of the 50 companies were 858.47. Therefore, the NIFTY PE Ratio was:
NIFTY PE Ratio today =19,428/859 =22.63
Consider reading: FINNIFTY Stocks List, Weightage, and Details
What is the Significance of the NIFTY PE Ratio?
The NIFTY PE Ratio is a measure of how expensive or cheap the Indian stock market is relative to its earnings. It indicates how much investors are willing to pay for every rupee of earnings generated by the 50 companies in the index.
A higher NIFTY PE Ratio means that investors are paying more for the same amount of earnings, which implies that they are optimistic about the future growth prospects of these companies and the economy.
A lower NIFTY PE Ratio means that investors are paying less for the same amount of earnings, which implies that they are pessimistic about the future growth prospects of these companies and the economy.
The NIFTY PE Ratio can also be compared with other valuation metrics such as price-to-book ratio (PB), dividend yield (DY), return on equity (ROE), and earnings yield (EY) to get a more holistic picture of the market’s valuation.
What level of NIFTY PE Ratio Should Investors Keep an Eye on?
There is no definitive answer to what level of NIFTY PE Ratio is considered high or low, as it depends on various factors such as interest rates, inflation, economic growth, corporate earnings growth, investor sentiment, and market expectations. However, one way to gauge whether the PE Ratio is high or low is to compare it with its historical average and range.
The average NIFTY PE Ratio since January 1999 is 19.6, and the median is 19.4. The highest NIFTY PE Ratio ever recorded was 42 in March 2000, and the lowest was 10.9 in October 2008.
Based on this historical data, we can say that a NIFTY PE Ratio above 24 is relatively high and a NIFTY PE Ratio below 15 is relatively low. However, these levels are not absolute and may change over time depending on prevailing market conditions.
Consider reading: Best Blue Chip Stocks in India
How to use NIFTY PE Ratio Chart and Information for Making Investment Decisions
NIFTY PE Ratio information can be used as one of the inputs for making investment decisions, but it should not be used in isolation or as a sole criterion. The PE Ratio can provide a general sense of whether the market is overvalued or undervalued, but it cannot predict the future direction or timing of market movements.
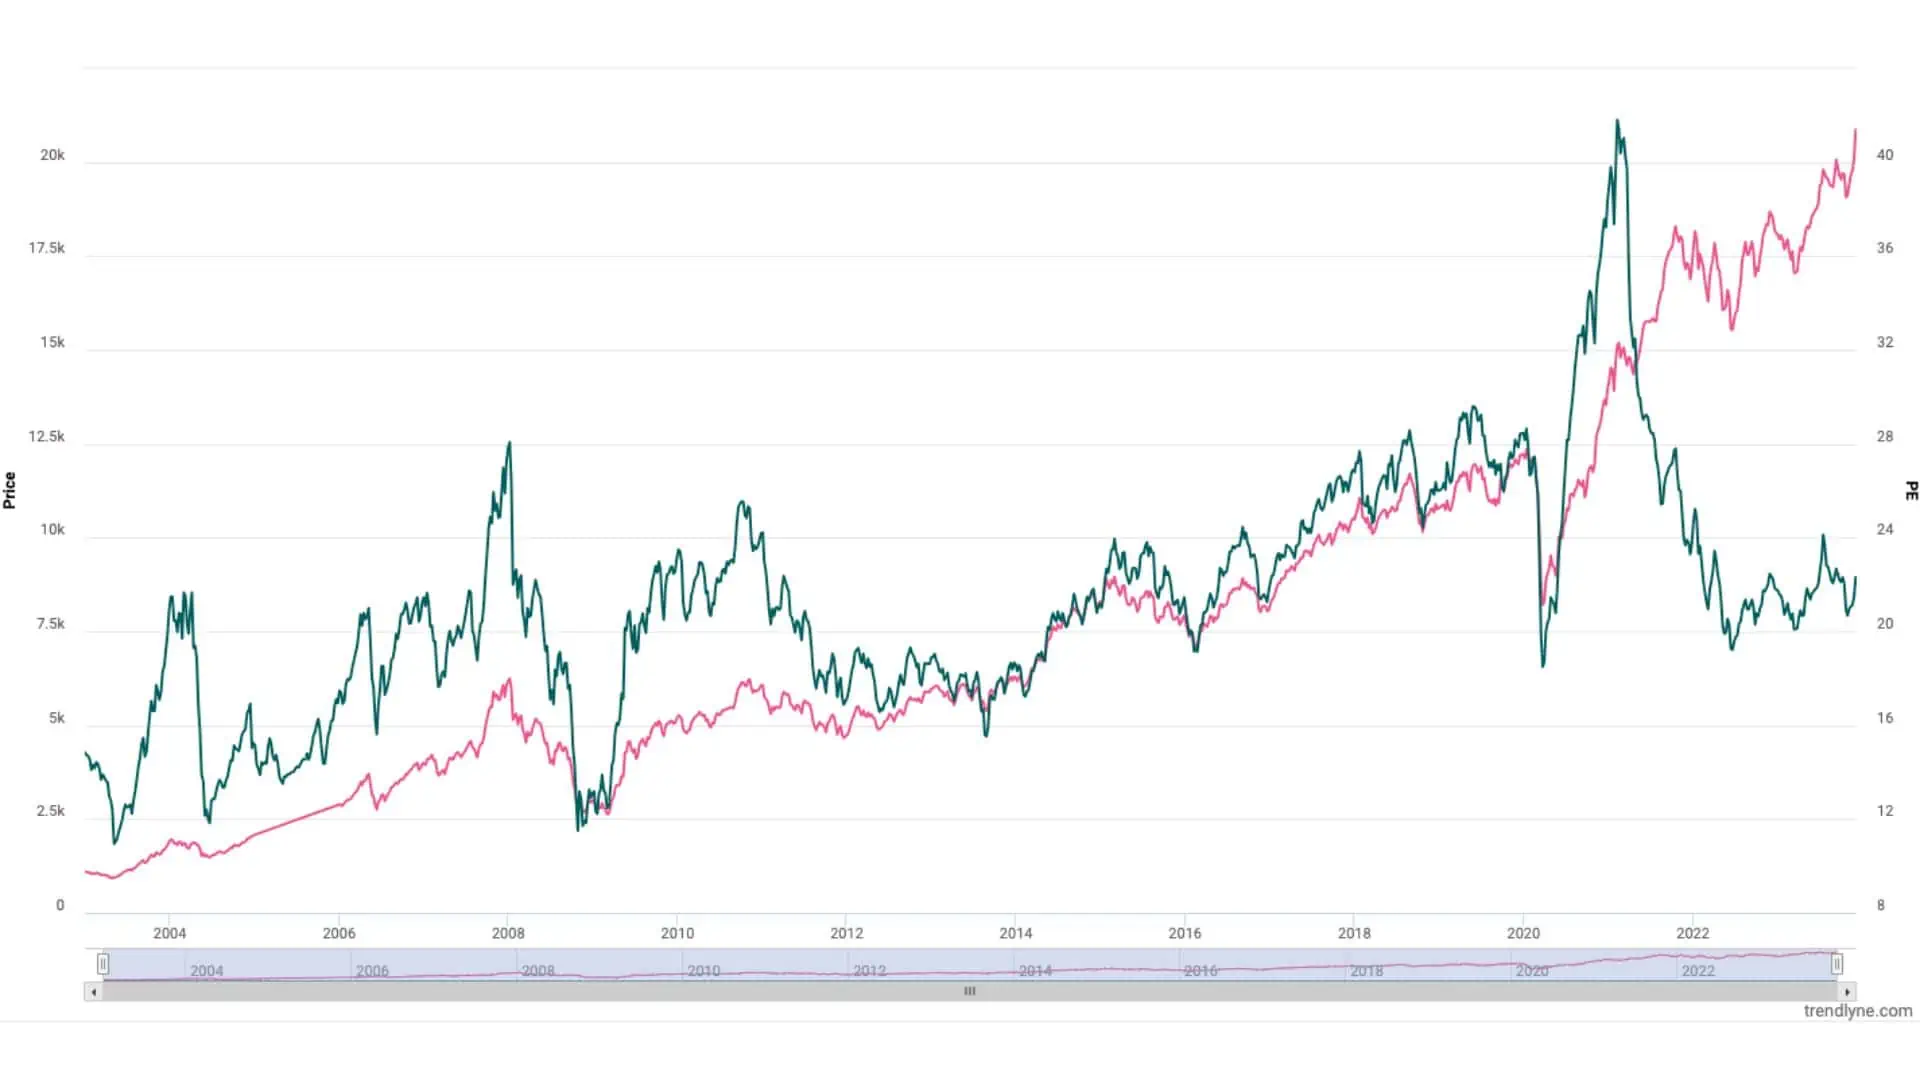
Source: Trendlyne
Moreover, the PE Ratio does not reflect the quality or growth potential of individual stocks or sectors within the index.
Therefore, investors should use NIFTY PE Ratio information along with other fundamental and technical analysis tools to evaluate the risk-reward profile of their investments. Investors should also consider their own financial goals, risk appetite, time horizon, and asset allocation before making any investment decisions.
Some possible ways to use NIFTY PE Ratio information for making investment decisions are:
- When the NIFTY PE Ratio is high, investors may adopt a cautious approach and reduce their exposure to equities or shift to defensive sectors such as FMCG, IT, pharma, etc., which tend to perform well in uncertain times. Investors may also look for undervalued stocks or sectors within the index that have strong fundamentals and growth prospects.
- When the NIFTY PE Ratio is low, investors may adopt an aggressive approach and increase their exposure to equities or shift to cyclical sectors such as auto, banking, finance, metals, etc., which tend to perform well in recovery times. Investors may also look for value stocks or sectors within the index that have been beaten down due to temporary factors but have the potential to bounce back.
- When the NIFTY PE Ratio is in the middle range, investors may adopt a balanced approach and diversify their portfolio across different sectors and themes. Investors may also look for growth stocks or sectors within the index that have consistent earnings and competitive advantages.
Final Thoughts on NIFTY PE Ratio
In this blog post, I have explained the NIFTY PE Ratio, which is a popular indicator of the valuation of the Indian stock market. I have shown you how it is calculated, what it signifies, what level of PE Ratio investors should keep an eye on, and how to use it for making investment decisions.
I hope you have found this blog post useful and informative. The PE Ratio is a powerful tool that can help you assess market conditions and plan your investment strategy accordingly.
However, remember that the NIFTY PE Ratio is not the only factor that you should consider when investing in the stock market. You should also look at other fundamental and technical analysis tools, as well as your own financial goals, risk appetite, time horizon, and asset allocation.
If you have any questions or feedback about this blog post, please feel free to leave a comment below. I would love to hear from you and answer your queries.
Also, if you liked this blog post, please share it with your friends and family who are interested in investing in the Indian stock market. Thank you for reading!