Pay Off Mortgage vs. High-Yield Savings or Treasuries
Should you pay down a 6.5%+ mortgage or hold cash in high-yield savings or Treasury bills? Compare after-tax yields, formulas, and liquidity trade-offs.

In an economic climate where 30-year fixed home loans hover between 6.5% and 7.5%, American homeowners face a decisive cash allocation choice. Should you channel surplus monthly cash into prepaying your mortgage, or does it make more sense to park funds in high-yield savings accounts (HYSAs) or short-term US Treasury bills?
On the surface, holding liquid cash earning 4.0% to 5.0% feels safe and comforting. However, superficial rate comparisons ignore the silent wealth destroyer: taxation.
As explored in our foundational mortgage payoff vs investing guide, every financial decision involves trade-offs between guaranteed returns, volatility, and liquidity. When you factor in federal ordinary income taxes and state income levies, the hurdle rate required for cash savings to match modern mortgage rates is surprisingly steep.
Key Takeaways
- Prepaying a mortgage delivers a guaranteed, 100% risk-free return equal to your note rate, completely free from federal and state income taxes.
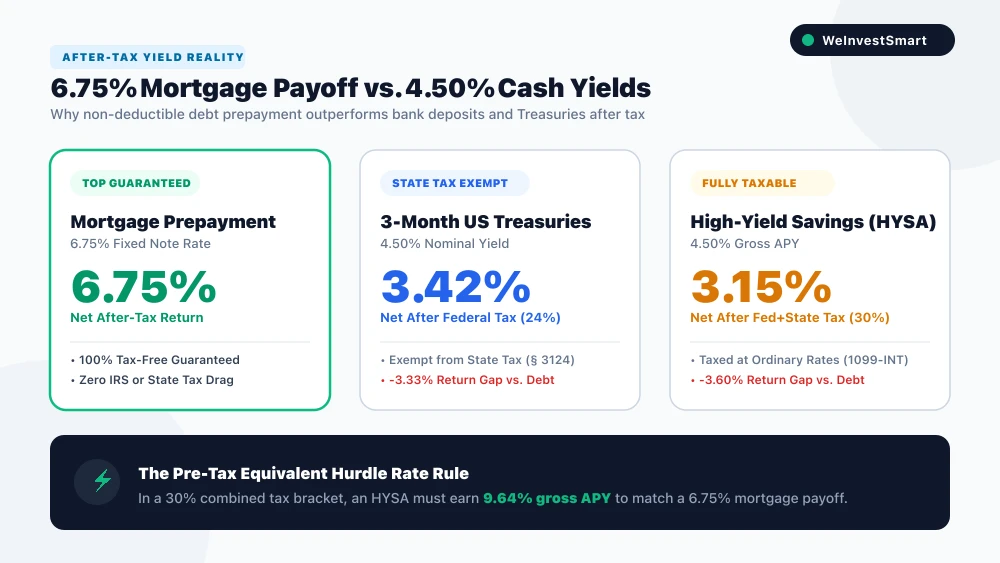
- Interest earned on High-Yield Savings Accounts is fully taxable as ordinary income on Form 1099-INT, shrinking a nominal 4.50% yield to just 3.15% after tax in a 30% combined tax bracket.
- US Treasury bills offer state tax exemption under 31 U.S.C. § 3124, but remain subject to federal ordinary income taxes, leaving net yields well below 6.5%+ mortgage debt.
- To match a 6.75% mortgage, an HYSA must generate a pre-tax equivalent yield of 9.64% for a taxpayer facing a 30% marginal bracket.
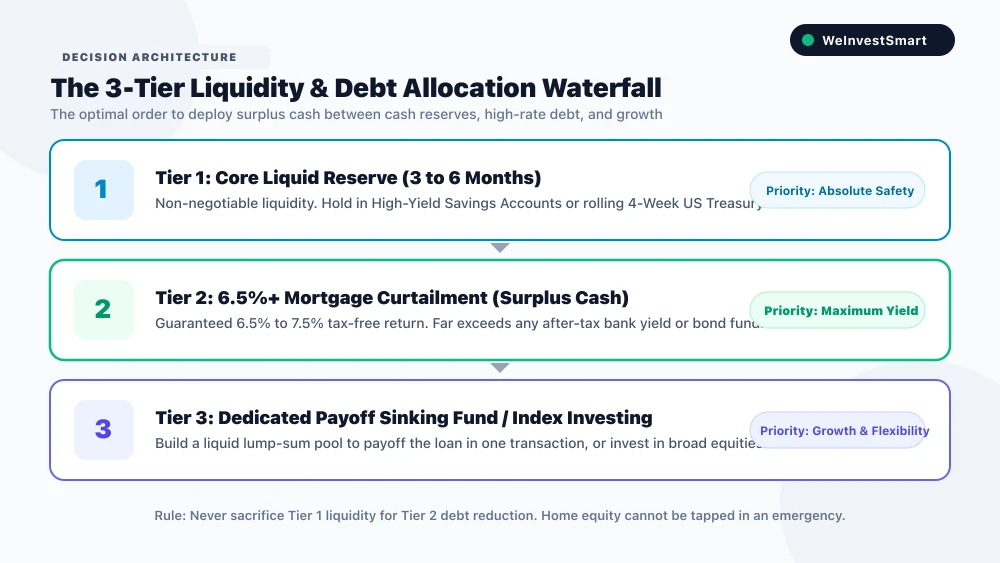
- Never deplete your core 3-to-6 month emergency reserve for mortgage principal, because equity locked in home walls cannot be spent during an acute crisis.
The Core Dilemma: Guaranteed Debt Relief vs. Liquid Cash Yields
For more than a decade following the 2008 financial crisis, the debt payoff versus cash savings debate was straightforward. Mortgage rates sat near historical lows between 2.75% and 3.5%, while bank accounts paid virtually 0.01%. Prepaying low-rate debt made little financial sense when broad stock indexes returned double digits.
Today, macroeconomic monetary policy has upended that paradigm. Data from the Federal Reserve Bank of St. Louis (FRED Series: MORTGAGE30US) demonstrates that prevailing 30-year fixed mortgage rates have sustained levels between 6.5% and 7.5%.
At the same time, risk-free cash vehicles have surged:
- High-Yield Savings Accounts (HYSAs) pay between 4.0% and 4.75% Annual Percentage Yield (APY).
- Certificates of Deposit (CDs) offer fixed APYs between 4.0% and 4.8%.
- Short-Term US Treasury Bills (4-week to 26-week) yield between 4.2% and 4.6%.
When homeowners see a 4.5% yield on bank deposits, many assume the spread between a 6.75% mortgage and a 4.5% savings account is only 2.25%.
In reality, comparing nominal percentages without adjusting for taxes is a severe analytical error. Mortgage debt is paid with after-tax dollars, whereas interest earnings are taxed at your highest marginal income tax rate.
The Tax Drag Reality: Why High-Yield Savings Accounts Fall Behind
Bank interest does not receive preferential capital gains tax rates. Under federal regulations, every dollar of interest earned in an HYSA or CD is classified as ordinary income and reported on IRS Form 1099-INT.
This means your savings earnings are taxed at your top federal bracket (22%, 24%, 32%, 35%, or 37%), plus applicable state and local income taxes.
To understand how tax drag erodes deposit returns, consider a homeowner in a 24% federal tax bracket living in a state with a 6% state income tax. Their combined marginal tax rate is 30.0%:
After-Tax HYSA Yield Formula
After-Tax Yield = Gross Nominal APY * (1 - Combined Marginal Tax Rate)
If this saver deposits $50,000 into an HYSA yielding a competitive 4.50% APY:
- Gross Annual Interest: $2,250.00
- Federal Income Tax (24%): -$540.00
- State Income Tax (6%): -$135.00
- Total Tax Liability: -$675.00
- Net After-Tax Interest Kept: $1,575.00
- Effective Net Yield: 3.15% APY
Because of taxes, the bank account does not actually yield 4.50%. It yields a modest 3.15% in spendable cash.
Meanwhile, prepaying a 6.75% mortgage eliminates interest you would otherwise owe to your lender. Because you avoid paying post-tax dollars, your effective return is an uncompromised, tax-free 6.75%.
The net performance gap between paying off the mortgage and holding the HYSA is not 2.25%. The true after-tax spread is 3.60% per year (6.75% minus 3.15%).
Before making extra payments, review whether your starting loan rate was optimized through our analysis of mortgage discount points break-even math.
Treasury Bills vs. HYSA: How State Tax Exemption Changes the Equation
Given the tax drag of ordinary bank accounts, many sophisticated investors look to short-term United States Treasury bills as a superior cash alternative.
Purchased directly through the official TreasuryDirect Treasury Bills portal or a taxable brokerage account, T-bills are short-term government debt obligations backed by the full faith and credit of the US government.
The primary tax advantage of Treasuries is established under federal statute 31 U.S.C. § 3124. Under this law, interest income on US government debt is entirely exempt from all state and local income taxes.
After-Tax Treasury Bill Yield Formula
After-Tax Treasury Yield = Nominal Treasury Yield * (1 - Federal Marginal Tax Rate)
This statutory exemption provides meaningful savings for residents of high-tax states such as California (up to 13.3%), New York (up to 10.9%), New Jersey (up to 10.75%), or Massachusetts (up to 9.0%).
To see the difference, compare a 4.50% T-bill against a 4.50% HYSA for a New York resident in the 24% federal bracket and 6.85% state bracket (30.85% combined):
| Feature / Metric | High-Yield Savings Account (HYSA) | 3-Month US Treasury Bill (T-Bill) |
|---|---|---|
| Nominal Gross Yield | 4.50% APY | 4.50% Annualized Yield |
| Federal Tax Rate (24%) | -1.08% | -1.08% |
| State Tax Rate (6.85%) | -0.31% | $0.00 (100% Exempt) |
| Net After-Tax Yield | 3.11% | 3.42% |
| Annual Net Earnings on $50,000 | $1,555.00 | $1,710.00 |
| Advantage over Bank Account | Baseline | +$155.00 net cash |
While Treasury bills clearly beat high-yield savings accounts in taxable accounts, their net yield of 3.42% remains far below a 6.75% mortgage interest hurdle.
Even with full state tax exemption, Treasury bills fail to keep pace with the return of paying down modern fixed-rate mortgage debt.
The Pre-Tax Equivalent Yield Formula: What Your Cash Must Earn to Win
To determine whether an alternative investment can justify not paying off your mortgage, financial planners use the pre-tax equivalent yield formula.
This calculation answers a simple question: What gross interest rate must an investment pay before taxes to match the guaranteed savings of paying down a mortgage?
Under IRS Publication 936 rules, mortgage interest is non-deductible for the vast majority of homeowners who claim the standard deduction. Therefore, your mortgage rate is your baseline after-tax hurdle.
The formula depends on whether the alternative asset is subject to state income taxes:
Pre-Tax Equivalent Yield Formula (Fully Taxable Assets - HYSA/CDs)
Required Gross Yield = Mortgage Interest Rate / (1 - Combined Marginal Tax Rate)
Pre-Tax Equivalent Yield Formula (State-Exempt Assets - US Treasuries)
Required Gross Yield = Mortgage Interest Rate / (1 - Federal Marginal Tax Rate)
Sample Calculations Across Tax Brackets
The table below demonstrates the gross yield your cash assets must generate to beat a 6.75% mortgage across various tax scenarios:
| Federal Marginal Tax Bracket | State Income Tax Bracket | Combined Tax Rate | Required HYSA / CD Gross Yield | Required Treasury Bill Gross Yield |
|---|---|---|---|---|
| 12% Federal Bracket | 0% (TX, FL, WA, NV, TN) | 12.0% | 7.67% APY | 7.67% Yield |
| 22% Federal Bracket | 5.0% State Bracket | 27.0% | 9.25% APY | 8.65% Yield |
| 24% Federal Bracket | 6.0% State Bracket | 30.0% | 9.64% APY | 8.88% Yield |
| 32% Federal Bracket | 6.0% State Bracket | 38.0% | 10.89% APY | 9.93% Yield |
| 35% Federal Bracket | 9.3% State Bracket (CA) | 44.3% | 12.12% APY | 10.38% Yield |
Notice the dramatic hurdle rates. For a typical dual-income professional household in the 24% federal bracket and 6% state bracket, an HYSA must pay 9.64% APY just to break even with prepaying a 6.75% mortgage.
Because FDIC-insured bank accounts and risk-free Treasury bills do not yield 9% to 12%, holding excess cash beyond an emergency reserve results in mathematical loss.
You can calculate your specific loan savings timeline using our free mortgage payoff calculator.
Worked Case Study: Allocating $50,000 Cash on a 6.75% Mortgage
To see the real-world dollar impact over a multi-year horizon, let us analyze a concrete scenario featuring Elena.
Elena has a $400,000 balance on a 30-year fixed mortgage at 6.75% interest with 28 years remaining. Her required monthly principal and interest payment is $2,594.39.
Elena has $50,000 in surplus cash sitting in an account. Her emergency fund is already fully funded elsewhere. Elena faces a 24% federal tax bracket and a 5% state tax bracket (29% combined).
She compares three distinct three-year strategies for her $50,000:
- Strategy 1 (Prepay Mortgage Principal): Apply the entire $50,000 lump sum toward her loan balance as a principal curtailment.
- Strategy 2 (Hold in High-Yield Savings): Deposit the $50,000 into an HYSA yielding an average 4.50% APY.
- Strategy 3 (Roll 3-Month US Treasury Bills): Invest the $50,000 into rolling 3-month Treasury bills yielding an average 4.50%.
The table below summarizes the financial results over three years (36 months):
| Metric / Outcome | Strategy 1: Mortgage Prepayment | Strategy 2: High-Yield Savings (HYSA) | Strategy 3: Rolling US Treasury Bills |
|---|---|---|---|
| Initial Allocation | $50,000 to Principal | $50,000 in Bank Savings | $50,000 in T-Bills |
| Gross Yield / Savings Rate | 6.75% (Guaranteed) | 4.50% Gross APY | 4.50% Nominal Yield |
| Effective After-Tax Rate | 6.75% (Tax-Free) | 3.20% (After 29% Tax) | 3.42% (After 24% Fed Tax) |
| Total 3-Year Interest Earned or Saved | +$10,875.00 saved | +$4,942.00 net kept | +$5,302.00 net kept |
| Taxes Paid to IRS / State | $0.00 | -$2,019.00 | -$1,674.00 |
| Net Financial Advantage vs. HYSA | +$5,933.00 ahead | Baseline | +$360.00 ahead |
| Remaining Loan Term Impact | Shortens loan by 7.2 years | No loan impact | No loan impact |
Breaking Down Elena’s Results
By prepaying her mortgage, Elena saves $10,875 in pure interest charges over three years.
If she had kept the cash in an HYSA, she would have earned $6,961 in gross interest, but handed $2,019 over to the IRS and state tax board, leaving her with only $4,942 in net gains.
By choosing debt payoff, Elena is $5,933 richer in real terms after just 36 months.
Over the remaining life of the mortgage, that single $50,000 lump sum saves her more than $118,000 in total interest and retires her home loan more than seven years early.
If Elena later wants to lower her required monthly payments without paying refinancing closing costs, she could also request a mortgage recast vs. refinance.
The Housing Liquidity Penalty: Why Home Equity Is Not an Emergency Fund
Despite the decisive mathematical superiority of mortgage prepayment, there is one crucial risk factor that math tables do not reflect: liquidity risk.
When you deposit money into an HYSA or buy short-term Treasury bills, your cash remains liquid. If you face sudden job loss, major medical expenses, or emergency home repairs, you can access your funds in seconds.
When you send $50,000 to your mortgage servicer, that cash is permanently absorbed into your home equity.
You cannot access home equity without:
- Selling the property, which incurs 6% to 8% in Realtor commissions, closing fees, and relocation disruptions.
- Applying for a Home Equity Line of Credit (HELOC) or cash-out refinance, which requires lender underwriting, verified current W-2 income, good credit scores, and appraisal fees.
If you lose your job during an economic downturn, a bank will not approve a HELOC precisely when you need the cash most. In financial planning, this vulnerability is known as the housing liquidity trap.
Therefore, the cardinal rule of mortgage prepayment is absolute: Never prepay a mortgage using money you might need in the next three to five years.
You must always maintain a robust liquid cash buffer before applying a single extra dollar toward your mortgage balance.
Calculate your minimum required liquid reserve using our free emergency fund calculator.
The Sinking Fund Compromise: Building a Liquid Mortgage Payoff Pool
If you are torn between the high returns of debt payoff and the security of liquid reserves, you do not have to commit to an irreversible lump sum. A sophisticated hybrid approach is the Mortgage Payoff Sinking Fund.
Under this strategy:
You keep your emergency reserve fully funded in an HYSA or short-term Treasury bills.
Instead of sending extra monthly principal payments to your lender, you direct discretionary savings into a separate, dedicated brokerage account or Treasury ladder.
Your money compounds while remaining 100% liquid and fully accessible.
When the balance in your dedicated sinking fund exactly equals your remaining mortgage principal, you execute a single payoff transfer, retiring your mortgage in one clean stroke.
The Trade-Off of the Sinking Fund
The sinking fund strategy provides immense peace of mind. If life throws an unexpected crisis your way, you have total access to a massive cash reserve.
The cost of this flexibility is the tax drag spread. As shown in our case study, holding cash in Treasuries instead of prepaying a 6.75% mortgage costs roughly 3.3% per year in lost efficiency.
Many homeowners consider that 3.3% spread a worthwhile insurance premium to maintain total liquidity until full payoff is achievable.
A 5-Point Allocation Matrix: Where Should Your Next Dollar Go?
To decide where your next available dollar should be directed, follow this structured 5-point decision hierarchy:
Do you have an uncaptured employer 401(k) match?
If yes, route money to your 401(k) first. A 50% to 100% employer match beats any mortgage or savings rate.Do you hold high-interest consumer debt (credit cards or personal loans)?
If yes, eliminate consumer debt immediately. Paying off debt at 18% to 26% APR delivers unmatched financial returns.Do you possess 3 to 6 months of living expenses in liquid cash?
If no, keep all surplus cash in an HYSA or Treasury bills until your core emergency safety net is fully funded.Is your mortgage interest rate above 6.0%?
If yes and your emergency fund is secure, extra cash directed to principal curtailment will mathematically crush bank savings accounts and Treasuries after taxes.Is your mortgage interest rate below 4.0%?
If yes, do not prepay your mortgage. Keep your money in Treasuries, HYSAs, or broad index funds, where yields comfortably exceed your borrowing cost.
By following this disciplined allocation order, you maximize after-tax wealth accumulation while protecting your family against unexpected liquidity shocks.
Frequently Asked Questions About Mortgage Payoff vs. Cash Equivalents
Is it better to pay off a mortgage or keep cash in a high-yield savings account?
Mathematically, paying down a 6.5%+ mortgage heavily outperforms a high-yield savings account. Mortgage interest savings provide a guaranteed, tax-free return, whereas bank savings interest is fully eroded by federal and state ordinary income taxes.
How does tax treatment affect the comparison between mortgage payoff and Treasury bills?
US Treasury bills are exempt from state and local income taxes under 31 U.S.C. § 3124, making them more tax-efficient than bank savings. However, Treasury yields remain subject to federal income taxes, so their net return is still significantly lower than a 6.5%+ mortgage rate.
What interest rate must a savings account earn to beat a 6.75% mortgage?
In a combined 30% federal and state marginal tax bracket, a high-yield savings account must pay a pre-tax yield of 9.64% to match a 6.75% non-deductible mortgage rate. Because cash deposit rates rarely exceed 4.5% to 5.0%, mortgages win by a wide margin.
What is the biggest downside of paying off a mortgage instead of holding cash?
The main risk is illiquidity. Money sent to a mortgage principal curtailment is trapped inside home equity. If you experience an emergency, accessing home equity requires lender underwriting approval, which may be denied during unemployment or illness.
This article is for educational purposes only and should not be considered personalized financial advice. Consider consulting with a financial advisor for guidance specific to your situation.
For educational purposes. Consider your own circumstances before making financial decisions. Read our editorial policy.
From reading to planning
Explore the numbers for yourself.
Use our free calculators to compare scenarios and understand your options.